Personal Care Shopper Insights Revealed in New PLMA Study

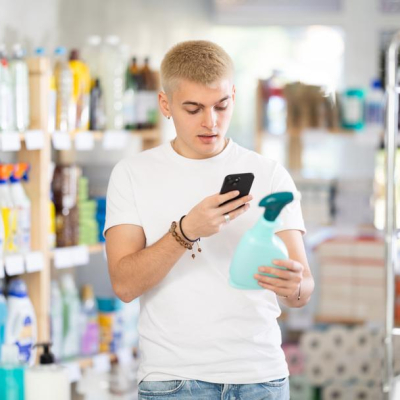
PLMA’s new personal care Shopper Intelligence study reveals how building shopper trust, overcoming category-level barriers and promoting cross-category adoption can unlock store brand growth. Sara Williamson, Ph.D., Associate Professor of Marketing, SUNY College at Old Westbury, will present the findings at this year’s Private Label Trade Show. Click here for more information.

Report: 54% of GLP-1 Users Seek Weight Management

For the first time, more than half (54%) of U.S. GLP-1 users take the medication primarily for weight management, surpassing use for diabetes and other health conditions, according to the EY-Parthenon GLP-1 Consumer Impact Report.

The findings suggest GLP-1 adoption is increasingly influencing consumer behavior beyond health and weight management, affecting what consumers eat and drink, how they shop, what they wear and where they allocate discretionary spending.

“We’re seeing these medications reshape consumer behavior in tangible ways, from food and beverage choices to wellness, fitness and discretionary spending. This shift is creating a ripple effect across the consumer products and retail landscape,” Katie Johnson, EY-Parthenon Americas Consumer and Health Industry Leader, said in a statement.

GLP-1 users prioritize nutrition-focused categories over traditional indulgence, with nearly two-thirds (63%) consuming fewer sweets and more than half (57%) reducing salty snacks. In turn, users increase consumption of fresh produce (66%) and protein (61%). Because 94% of GLP-1 users surveyed are primary grocery shoppers, these changes often extend beyond the individual, influencing household meal planning, cooking habits and grocery purchasing decisions.

This shift is also evident in beverages: more than half of users (51%) report drinking fewer soft drinks, while 44% consume more functional beverages. Meanwhile, 45% have reduced alcohol consumption and 40% have stopped altogether.

Poll: Declining Confidence in Safety of Grocery Store Food

Americans’ confidence that food sold at most grocery stores is safe has fallen to its lowest level recorded, with 65% now very or somewhat confident, according to a Gallup poll.

That’s down from 73% last year and 72% in 2024, and well below the 81% recorded in 2019.

The latest poll also updated a question asking Americans whether they had taken each of three steps within the past year in response to a government food safety advisory or product recall.

The most common, and the one that has increased the most since 2024, is avoiding purchasing certain brands or types of food. Seventy-three percent of U.S. adults say they have done this in the past year, up 20 points from 53% saying so in 2024. The current figure also exceeds the percentages avoiding certain foods in 2007 (62%) and 2008 (60%), when significant food safety issues were in the news.

Additionally, 45% of Americans say they have thrown out or returned a food product to the store in the past year, up from 37% in 2024 and slightly higher than the 40% found in 2007. Similarly, a trend-high 42%, up from 26% in 2024, say they have worried that something they ate may have been contaminated.

The decline in confidence in the safety of grocery store food since last year is concentrated among Democrats and Independents, while Republicans have become more confident. Democrats' confidence that grocery store food is safe has fallen 14 points to 66%, while Republicans' has risen nine points to 77%. Independents' has dropped 10 points to 60%.


New Market Data: Soaring Aseptic Juice Sales

The stability, portability and on-the-go convenience of aseptic juices has contributed to substantial sales growth.

Dollar sales in all outlets jumped 23% to $143.6 million, while units grew 18% to 44.3 million for the 52 weeks ending October 4, versus the same period the previous year, according to Circana's Unify+/PLMA.

Stats and Facts: At Q3, Store Brands Still Outperform National Brands on Sales

At the Q3 mark of 2026, store brands are still winning the sales competition with national brands. They outperformed national brands in unit sales gains over the first nine months of 2026 by more than one full percentage point, increasing by 0.3%, while national brand unit sales declined by 0.8%.

During a challenging year in which American consumers increasingly scrutinized their food and nonfood grocery purchases, store brand unit sales outgained national brands in eight of the 10 reporting periods, according to Circana's Unify+/PLMA.

As a result, store brand unit share moved up to 23.5%. At the Q3 mark, store brands were also in the black in dollar sales, ahead by 0.3% compared to the same time last year. Store brand dollar share came in at 21%.

Among the product departments monitored for PLMA by Circana, Beverages was the leader in store brand dollar sales gains over the 52 weeks ending October 4, improving by 5.4%, followed by Auto, +4.1%; Frozen, +2.8%; Pet Care, +2.7%; General Merchandise, +2.6%; General Food, +2.2%; Household Essentials, +1%; and Beauty, +0.5%. In department store brand unit sales gains, Pet Care was first in line, up 2.8%, then Beverages, +2.3%; Refrigerated, +1.9%; and Frozen and General Food, both +0.3%.

Report: Majority of Gen Z, Millennial Shoppers Use AI

Generative AI is rapidly becoming part of the shopper journey, with 34% of shoppers using AI tools to shop and nearly half of Gen Z shoppers influenced by AI in recent purchase decisions, according to a new Acosta Group study.

“Success requires brands to build new or elevated pathways for their products to be understood, recommended, compared and selected by any AI,” said John Carroll, president of Connected Commerce for Acosta Group.

Gen AI has moved into the mainstream, garnering broad use by Gen Z and millennial shoppers (74%), and a fast-rising 45% of boomers. ChatGPT and Google Gemini are shoppers’ preferred tools, with Gemini already routinely used by 25% of shoppers when searching online for products.

Shoppers report saving money, product comparisons, saving time and product research as their primary reasons for using an AI tool. Fifty-five percent of Gen Z shoppers who use AI tools are using AI as they shop in store. AI usage remains highest for frequently purchased product categories, including grocery and household items, and health and wellness products.

Gen AI continues to rank as trustworthy as other sources for 60% of all shoppers using the tool. The study reflects that trust is damaged when incorrect or misleading data is delivered, or when shoppers are concerned that AI recommendations are biased by ads, further highlighting the need for brands to ensure accuracy of details across all platforms.

Transparency about how shopper data is stored and protected remains a concern for 48% of all shoppers.

There is an increase in data sharing among some segments. Younger shoppers willing to share information with Gen AI say they are now more likely to share additional personal details, such as their photo or medical history. Similarly, grocery shoppers willing to share information are now more willing to share their preferences, stores or brands with Gen AI.

Autonomous purchasing remains challenging. In 2026, only 22% of those using Gen AI for shopping trust agents to make purchasing decisions for them. That number increases to 35% for millennials.

AI’s influence on purchasing is growing. Half of Gen Z and millennials who use AI tools reported that AI had influenced their buying decisions in the past three months.

For shoppers influenced by AI, its primary impact was helping them choose from among product options. The value of brand awareness and loyalty was apparent, as nearly half said they’d likely select a known brand if presented an unfamiliar option.

However, 40% reported that they had tried a new brand, highlighting opportunities for discovery.

2026 Private Label Report: $282.8 Billion in Sales

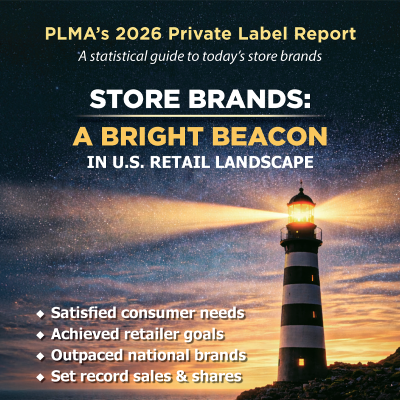
U.S. sales of store brands increased slightly more than $9 billion to a record $282.8 billion in all outlets last year compared to 2024, according to PLMA's just-released 2026 Private Label Report, based on exclusive Circana Unify+™ data.

Entitled "Store Brands: A Bright Beacon In U.S. Retail Landscape," the report documents new levels of growth for the U.S. store brands industry. Click here to read it.

It reveals that store brand dollar sales increased nearly three times the rate of national brands, climbing 3.3%, compared to a gain of only 1.2% for their national brand counterparts for the 52 weeks ending December 28, 2025.

Store brand unit volume was up by 434.3 million to 68.7 billion, also setting a new record. This represents a 0.6% rise, while national brands declined by -0.6%.

In store brand unit sales gains, the best performing department for 2025 was Pet Care, up 5.4%, followed by Liquor +4.4%; Beverages, +2.3%; Frozen, +0.9%; Refrigerated, + 0.7% and General Food, +0.2%.

In dollar sales, seven departments finished ahead of the prior year. The Refrigerated department expanded the most, gaining 6.1% in store brand revenue, followed by Beverages, +4.8%; Pet Care, +3.7%; Beauty, +2.8%; Frozen, +2.4%; General Food, +1.6% and General Merchandise, +0.9%.

Watch our news report on the sales data here:

Sales Alert: New Market Data

Overall Sales Figures:

Store brand unit sales in the U.S., building on strong 2025 momentum, posted a solid 2.3% gain for the 52-week period ending January 25, 2026 when, according to Circana's first 2026 report to PLMA, national brands grew 2.4% over the same period.

Department Overview:

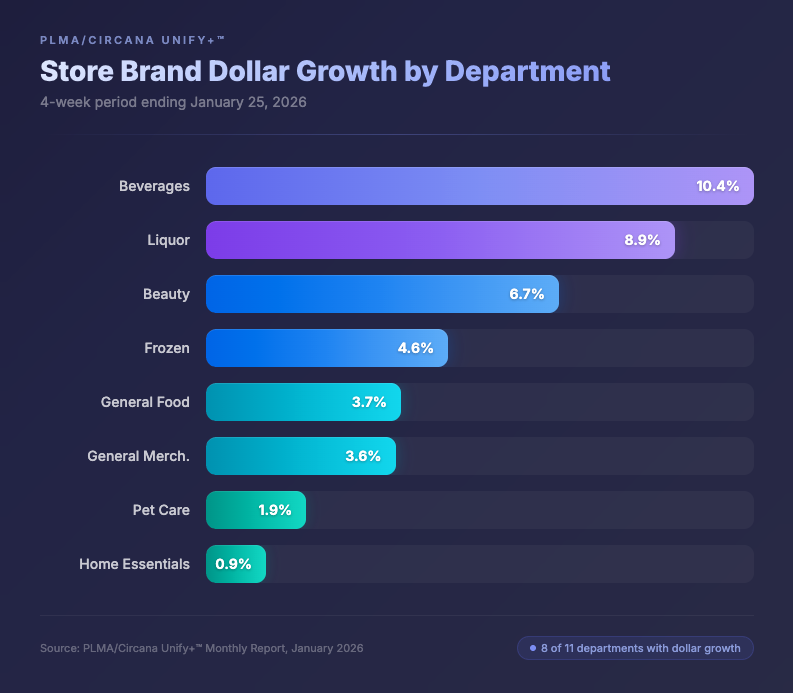
Of the 11 departments covered on a monthly basis, eight of the departments showed store brand dollar growth and seven had unit growth for the four week-period ending January 25.

Store Brand Dollar Growth

Beverages showed the largest dollar growth in January with 10.4%, followed by Liquor (8.9%), Beauty (6.7%), Frozen (4.6%) and General Food (3.7%). The other nonfood departments showing private label dollar growth over the first 4 weeks of the year included General Merchandise (3.6%), Pet Care (1.9%) and Home Essentials (0.9%).

Store brands also started the year with unit growth, especially in food departments.

Liquor (9.2%), Beverages (6.1%), Refrigerated (3.7%) and Frozen (1.8%) had strong growth.

Pet Care (1.8%), General Food (1%) and Beauty products (0.3%) rounded out the list.

The PLMA/Circana Unify+™ monthly reporting tool provides topline insight into private brand department and category trends in dollars and units. PLMA members and retailers receive complimentary access. Click here for details on how to become a member and access the data.

Store Brand Performance: Fast-Growing Departments

Product departments across the board experienced store brand market share gains last year, according to PLMA’s 2024 sales data from Circana Unify+.

Store brand unit share increased in all nine departments, with the best gains in General Food (+0.7%), followed by Beverages, General Merchandise and Home Care, all +0.5%. Store brand unit share is highest in General Merchandise, at 41.4%; then Refrigerated (38.4%); Frozen (27.5%) and Health (25.5.%).

In store brand dollar share, the leading gains were recorded in Frozen (+0.6%); General Food (+0.5%) and General Merchandise (+0.4%). Top store brand dollar shares are in Refrigerated (36.4%); General Merchandise (33.4%); and Frozen (25.9%).

Store brand expansion occurred across the store. The products racked up dollar sales gains in 129 of 167 edible categories (77% of them) and unit sales improvements in 118 (71%). Among 153 non-edible categories, dollars grew in 79 (52%) and units were up in 85 (56%).

Total store brand sales for 2024 surpassed a quarter trillion dollars, coming in at $271 billion, establishing an all-time high in annual revenue. Sales of store brand units were 67.4 billion, also a record.

Annual sales of store brands increased by $51.7 billion, or plus 23.6%, over the past four years while unit sales moved ahead 2.1%, or up 1.4 billion. Over the same period, national brands gained 11.5% in annual dollar sales but slumped -6.8%, or down 16.2 billion, in units.

One of four grocery products purchased in the U.S. during 2024 carried the store's name or one of its proprietary brands.

Dollar sales increased 4x that of national brands last year as the products powered ahead 3.9% compared to a gain of only 1% for their branded counterparts. Looking at unit sales, the disparity was similar. Store brands advanced 2.3% versus the figure for all of 2023 while national brands fell -0.6%.

Departmental sales provide a broad picture of the 2024 numbers. All ten food and non-food sections finished ahead of the prior year in dollar sales with the two largest -- Refrigerated (+ 7.5%) and General Food (+4.3%) -- gaining the most. In unit sales, nine of ten improved, led by Beverages and Pet Care, both 3.5%.

Top 5 grocery trends

NIQ has released a report on the five biggest grocery trends that will shape 2025. The first trend is “Private Label Continues to Grow”. Globally, 50% of respondents report that they are purchasing more private label products than ever before. Shifting demographic patterns and consumers’ increasing focus on value-driven shopping is not expected to change.

Second trend is “Sustainability Matters to Consumers”. 95% of consumers say they are trying to take some action to live sustainably. NIQ advises companies to make sustainable attributes of products accessible on product pages and clear on packaging. Trend 3 is “Consumers are Trying to Save”. Inflationary pressures coupled with increased housing costs and broader economic uncertainties are causing consumers to adjust their purchasing habits to navigate a financially challenging landscape. To stay relevant with these shifting consumers, more premium grocery brands may need to do a better job of conveying the true value of their products and position them as purchases worth the extra expense.

Fourth trend is “Pricing and Promotions are Key”, dynamic pricing, personalized pricing, or automated pricing coupled with thought-out promotion strategies are key to success. Last trend is “Omnisales are on the Rise”: sales of CPG products purchased online are growing and the area with the most opportunity for online sales growth going forward is Food. Increasing sales in an omnichannel world requires focus and accurate, actionable data. Tracking retail sales, market trends, and consumer behavior all play a role in the process of aligning product offerings with consumers’ needs and be visible across all channels.