

As ever, store brands represent significant savings for shoppers. The proof can be found in the independent sales data. Using average cost per unit, in a store wide price comparison between store brands and national brands, based on data from Circana, PLMA calculates the U.S. consumers saved about $35bn in 2025 by choosing a store brand over a national brand in their regular grocery shopping.
One of every four food and non-food grocery products purchased is a store brand that was supplied by a private label manufacturer. For a majority of shoppers, store brands represent quality and performance as good as or better than national brands while offering meaningful savings.
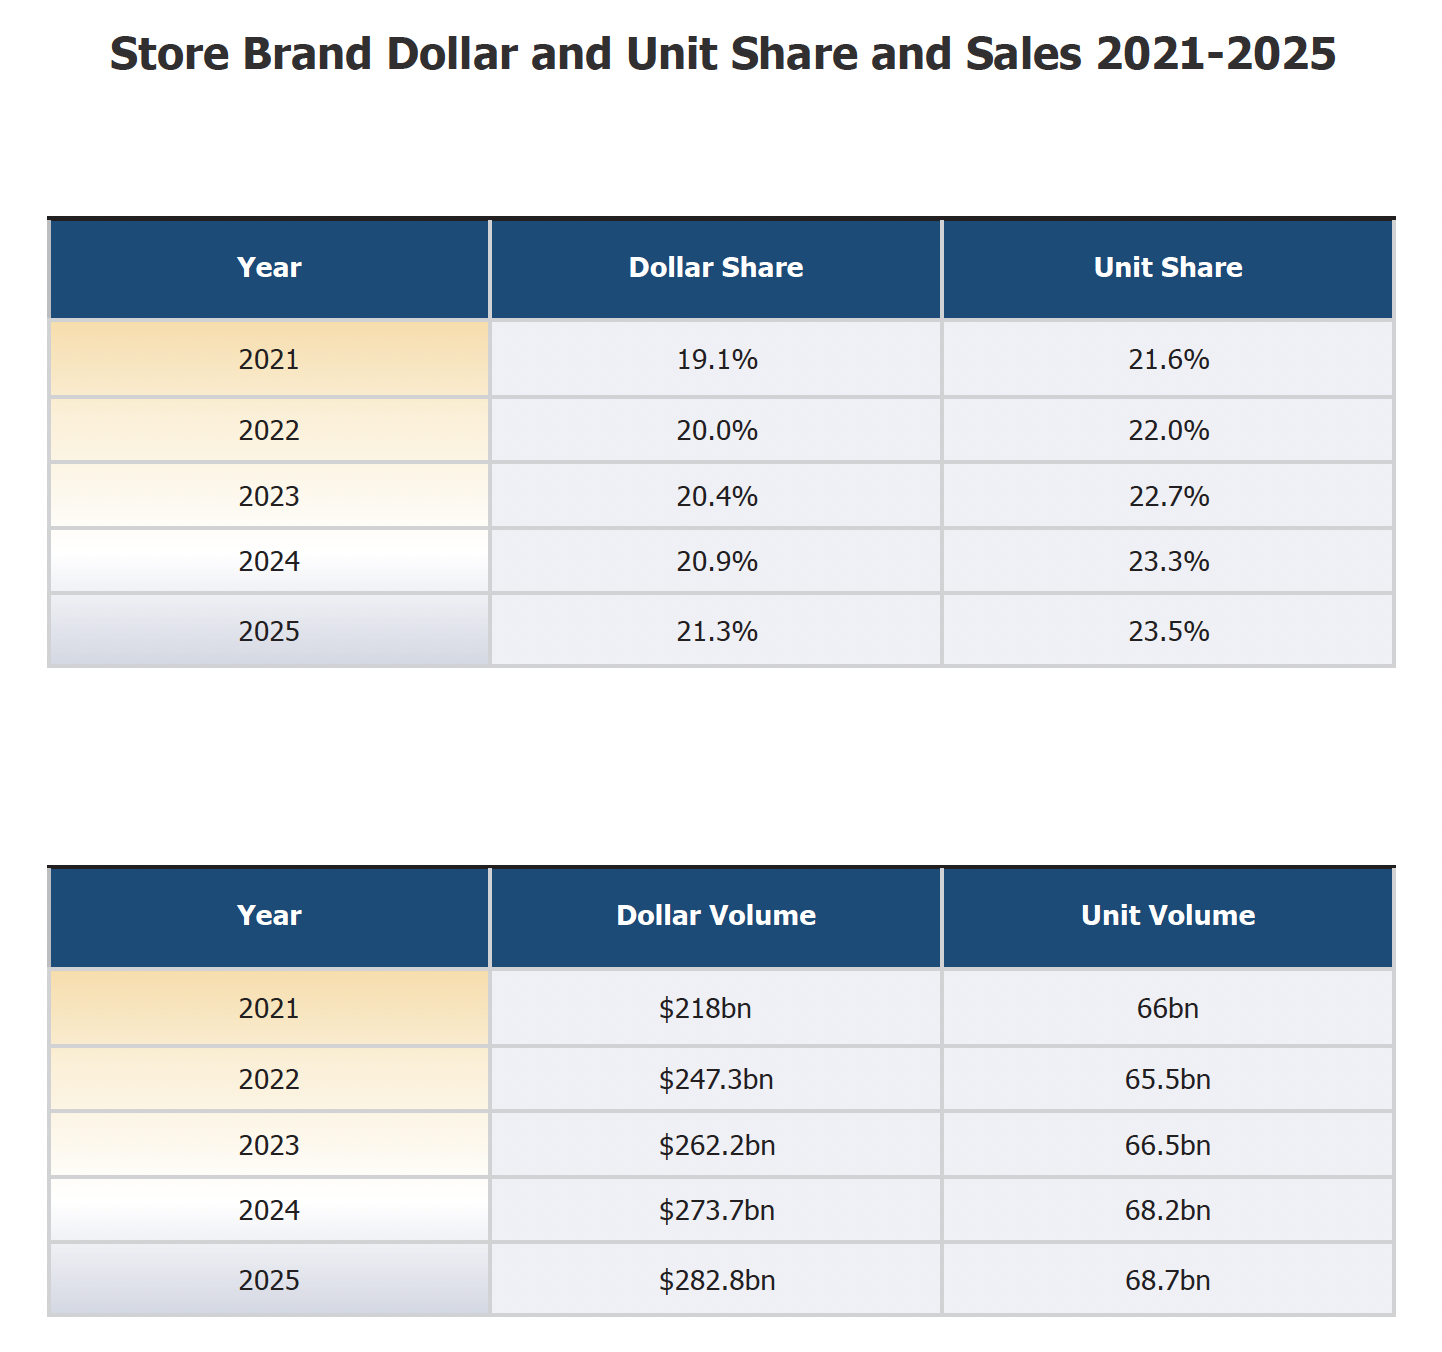
In 2025, total sales of store brands reached $282.8 billion -- an increase of $9 billion year-over-year and a new record -- across brick and mortar and online supermarkets, drug chains, and mass merchandisers. Total sales of store brand units were up almost half a billion to 68.7 billion, also a record.
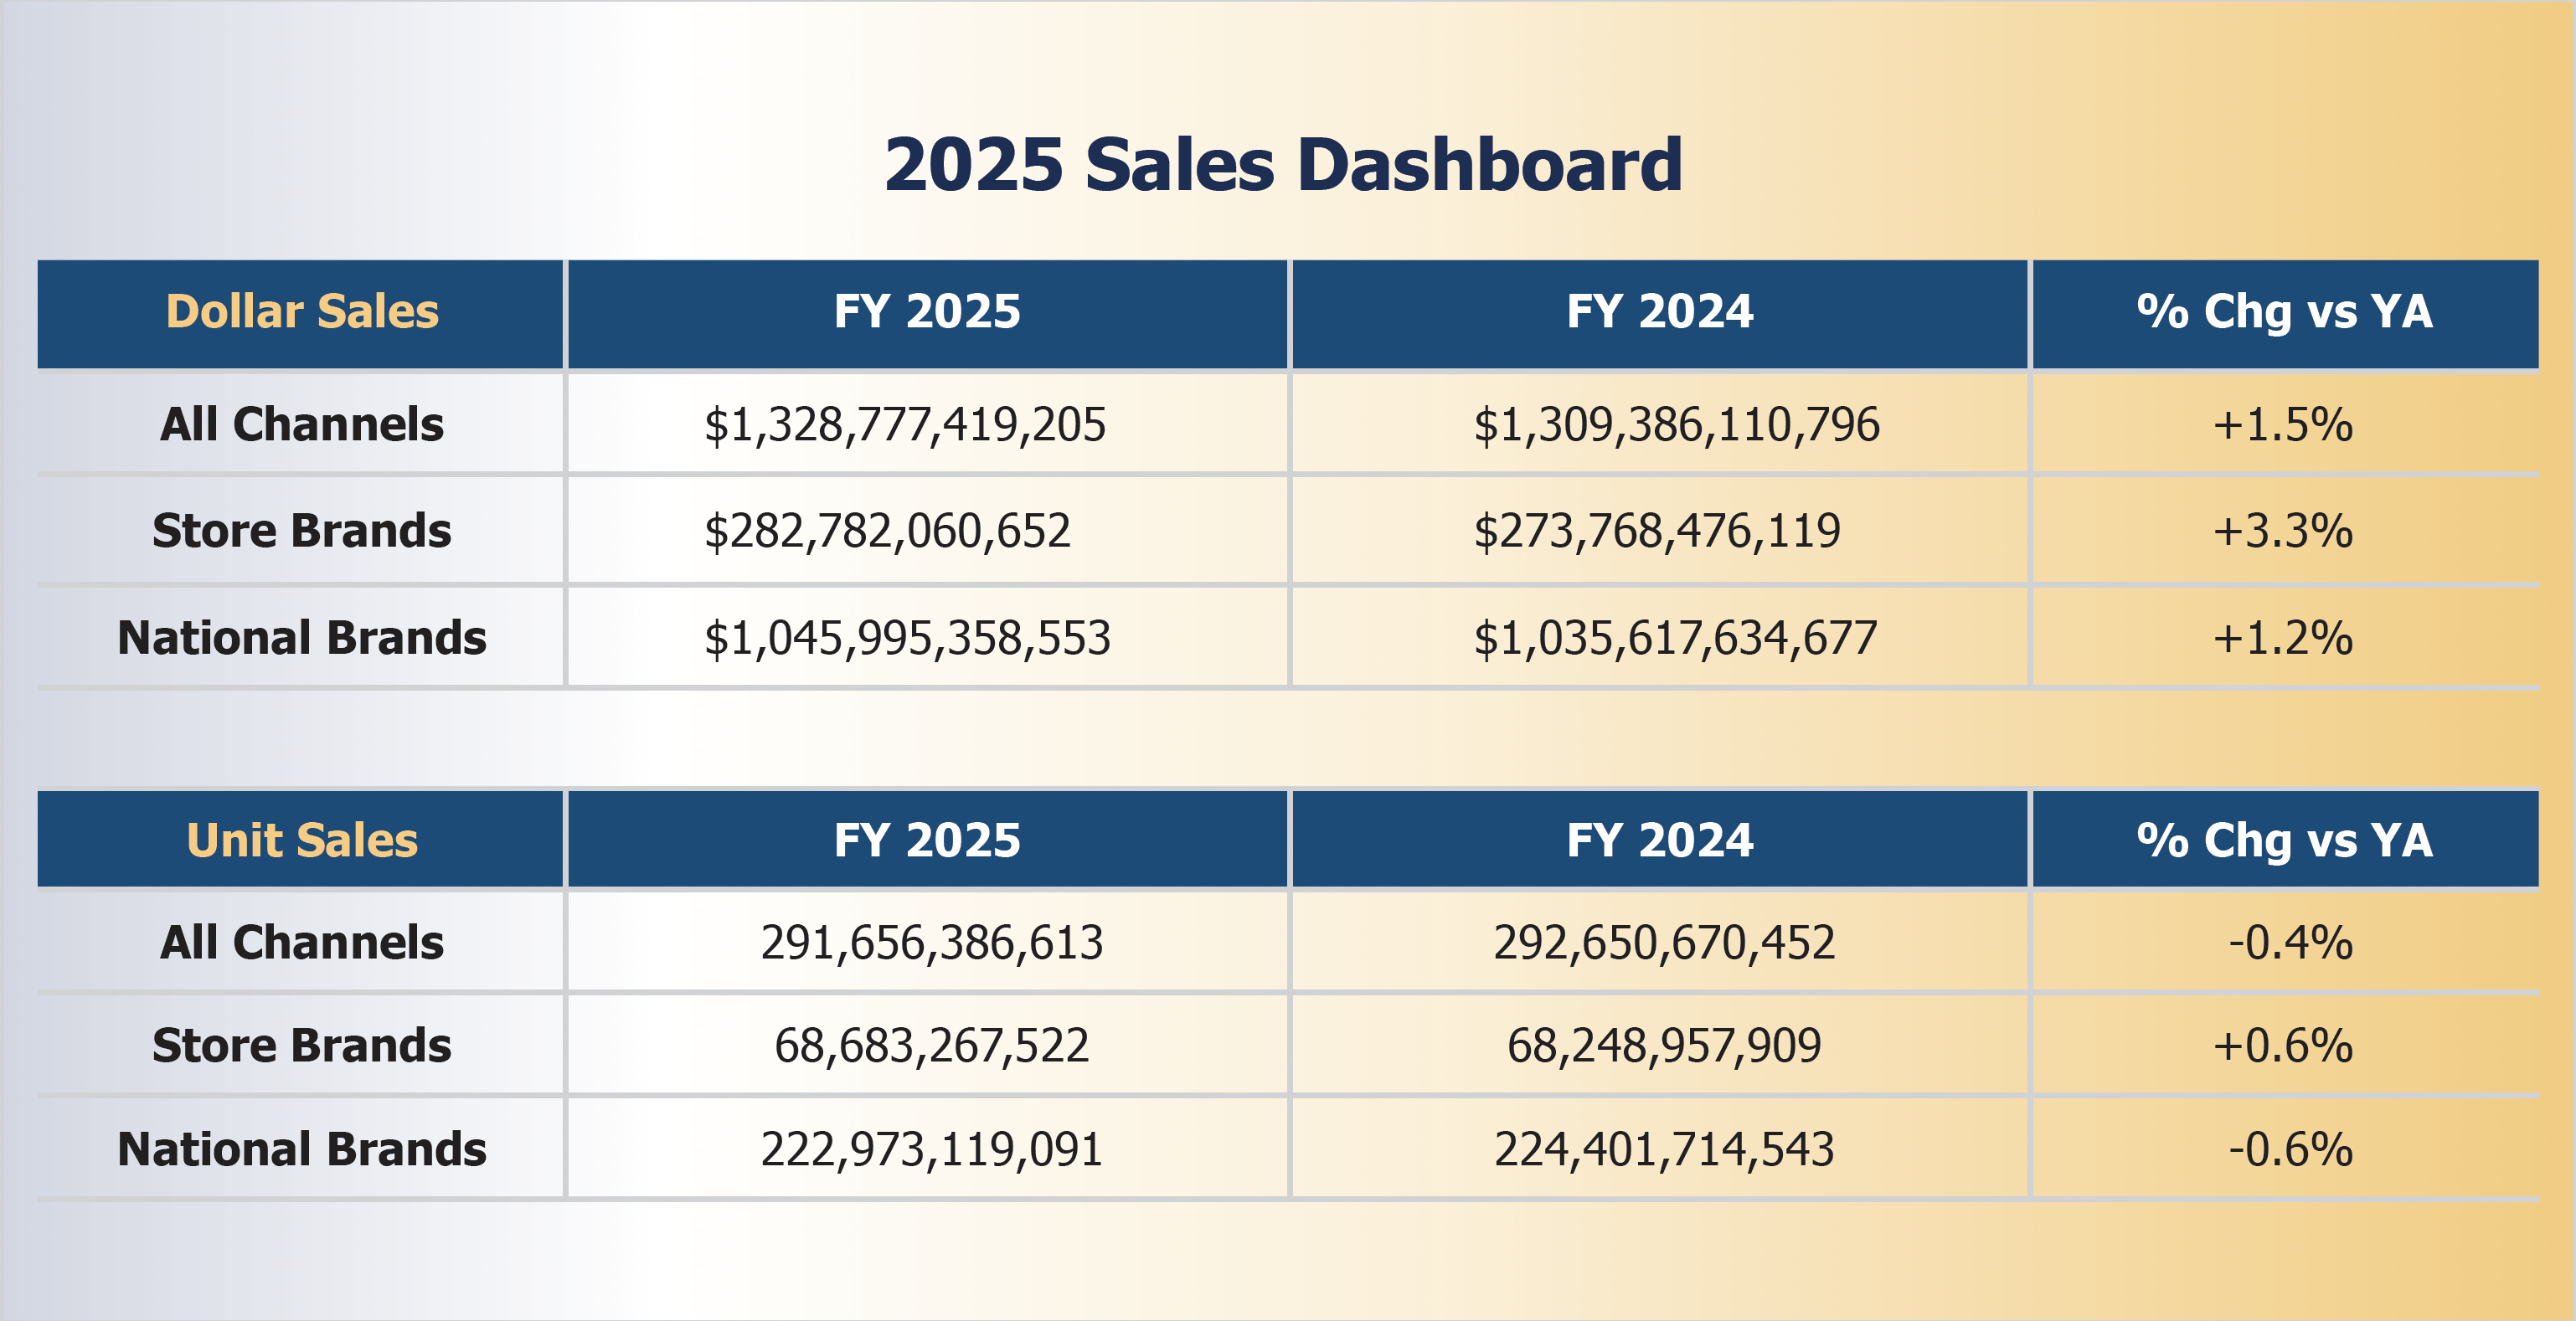
Store brands set all-time highs in both market share metrics, moving up to 21.3% in dollar share and up to 23.5% in unit share for the period from December 29, 2024, to December 28, 2025, per Circana Unify+, PLMA's exclusive provider of sales data.
Store brand dollar sales increased almost three times the rate of national brands as the products surged 3.3% compared to a gain of 1.2% for their branded counterparts. In unit sales, the head-to-head disparity was much the same. Store brands advanced 0.6% while national brands fell -0.6%.
Over the past five years, from 2021 to 2025, store brand annual dollar revenue increased by $64.8 billion, or plus 30%, and dollar share rose from 19.1% to 21.3%. Annual unit sales of store brands advanced by 2.7 billion, or plus 4%, and unit share improved from 21.6% to 23.5% during the period.
Seven departments tracked by Circana had gains in store brand sales. The Refrigerated department expanded the most, gaining 6.1% in store brand revenue for the 52 weeks ending December 28, followed by Beverages, +4.8%; Pet Care, +3.7%; Liquor, +3.6%; Beauty, +2.8%; Frozen, +2.4%; General Food, +1.6% and General Merchandise, +0.9%.
In store brand unit sales gains, the best performance among departments was by far Pet Care, up 5.4%, followed by Liquor at +4.4%, then Beverages, +2.3%; Frozen, +0.9%; Refrigerated, + 0.7% and General Food, which was up +0.2%.
For more information on 2025 store brand and national brand sales, including department, category and subcategory data and monthly trends, please go to PLMA's 2026 Private Label Report in The Industry/Research, Reports & Publications section of this website. PLMA members and retailers can access current nationwide sales data anytime by signing in to Circana’s Unify+ portal at members.plma.com.
What Are Store Brands? Who Makes Them?
Simply stated, store brands are the products that carry the retailer's name or private brands. Surveys reveal that nearly every shopper buys store brands with a high degree of regularity and in volume. So, consequently, they are ubiquitous in the home. Store brand products can be found in the refrigerator, pantry, or medicine cabinet; in the office space, basement, shed or garage.
They often carry the chain's own proper name, or a variety of brand names created exclusively by the retailer for its stores. In some cases, a store may belong to a wholesale buying group that owns labels made available to the members of the group. These wholesaler-owned brands are referred to as controlled labels.
Store brand items are offered in just about every one of the hundreds of food and non-food grocery categories: fresh, frozen and refrigerated; canned and dry foods; snacks, pet care, health and beauty items; over-the-counter drugs, cosmetics, household and laundry products; lawn and garden chemicals; paints, hardware, auto aftercare, stationery, and housewares; among other sections in the store.
Retail chains of all sizes develop and market store brands in various ways. They may create a whole line of products around a particular feature – such as Safeway's O Organics, Eating Right and Open Nature; Kroger's Simple Truth, Comforts for Baby, and Private Selection; Albertsons' Essential Everyday and Wild Harvest, or Aldi's Simply Nature.
In other cases, a majority of the store brand SKUs might all carry the same name – such as Costco's Kirkland Signature, Wal-Mart's Great Value, Whole Foods' 365 Everyday Value, or Meijer Gold. The chain's name can also serve as an eponymous store brand: Walgreens, CVS, Rite Aid, Family Dollar, DG, Wegmans, Giant Eagle, Publix, Raley's and Trader Joe's are examples.
Store Brands Are Everywhere
Store brands are everywhere. When it comes to how the products can help meet their family's needs, consumers are turning to private label in a variety of retail chains beyond their favorite food, drug and discount store.
Specialty chains – such as those selling home office products, hardware, domestic goods, consumer electronics, baby and child care, home improvement, do-it-yourself, pet care, toys, personal care and others – are bringing to market a variety of products that compete on equal terms with the national brands in that sector. Familiar store brands in these channels include eponymous lines from Staples, Ace and Petco; as well as unique brands from Home Depot (such as Husky, Hampton Bay, HDX) and Lowe's (Kobalt), among others. Store brands are becoming prevalent in these specialty chains for the same reasons they have grown in supermarkets, drug stores and discount stores. They are available in multiple SKUs and offer the same advantages in performance and savings that consumers expect from store brands that meet their grocery needs.
Many of these non-grocery chains started out primarily as sellers of big brands. But the emergence of high quality and dependable private label manufacturers in these spaces has enabled them to undertake a strategic expansion into store brands much like their counterparts in grocery have over the past few decades.
So, the store brands advantage is not just available to consumers with their cereal, orange juice and aspirin purchases. They can purchase store brand printing paper and writing instruments; toys and games; housewares, kitchenware, and small household appliances; tools and paint; and linens, towels and home décor such as vases, bowls and picture frames. They do so with the same confidence that they are getting top quality and performance at significant savings when compared with to the brands.
Where Do Store Brands Come From?
For many consumers, store brands have become an important ally in how they are able to provide their families with high quality, great value, everyday products at a lower cost than most national brands. And store brands have also become important to retail chains, another reason they have grown so quickly. They give the chains a way to set themselves apart from the competition and enable them to offer their customers more choice.
Historically, store brands signified good value for consumers while national brands were generally seen as the premium item in a category. That is no longer true. Many chains now offer premium products that are not solely focused on value but on uniqueness and high quality and performance. As they become more than just a place to buy products, a merchant, the nation’s stores are motivated to find and develop items they can put their own name or brands on and become a true marketer of their own goods.
But where do store brands come from? For the products, chains turn to store brands manufacturers. When they do, they demand high quality across the board – from ingredients to the supply chain, from the packaging and labeling to the final product itself. Store brands manufacturers who meet those high standards come in all sizes and many are listed on major stock exchanges. There are thousands of companies operating in hundreds of categories that supply products in partnership with retailers.
Store brands manufacturers fall into several classifications:
•Large national brand manufacturers that utilize their expertise and excess plant capacity to supply store brands.
•Small, high-quality manufacturers that specialize in particular product lines and concentrate on producing store brands almost exclusively. Often these companies are owned by corporations that also produce national brands.
•Major retailers and wholesalers that run their own manufacturing facilities and provide store brands for themselves and, in a few cases, for other retail chains as well.
•Regional brand manufacturers that produce private label products for specific demographic markets.
•Large, nationwide manufacturers of store brands across a range of food and non-food product categories who supply a multiplicity of retail chains and channels in the U.S. and even internationally.
Store Brands Meet All Standards & Requirements
These companies take steps to ensure their products meet the same exacting standards and requirements of national brands. Just like the big brands, store brands are tested and analyzed for quality and safety by independent companies before they ever reach store shelves. When it comes to food, retailers and their private label suppliers abide by the Nutrition Labeling and Education law that requires standard labeling, while content and health claims need to meet FDA regulations. Non-food items also conform to prevailing federal and industry standards and regulations.
Private label suppliers also manufacturer, package, and label products to meet the stores' own rigorous specifications. These may be tailored for a specific product and even exceed general standards on quality and performance. Each store’s private label line has its own unique identity and the products’ packaging reflects that. One of the reasons store brands have grown is the recognition of the importance of functional and attractive packaging. Not only how the package looks but also how it opens and seals; as well as sits on a shelf, pantry, tabletop, or refrigerator.
While packaging makes an important first impression on the shopper, ingredients and quality remain paramount. With most consumers saying in polls that they believe store brands are as good as, or even better than, national brands, the next logical step is to be more innovative. And innovative products can be found all over -- from fresh and frozen cases in supermarkets to health and wellness-oriented, diagnostic items on drug store shelves and to household cleaning products arrayed in discount stores. Another area of innovation is the development of products targeted to specific consumer needs, tastes and interests, such as ethnic, gluten-free, low fat, reduced calories, diabetes-approved, international and U.S. regional cuisines, and "better for you" items. Organics, plant-based, vegan, and natural are store sections that are particularly busy with such on-trend store brand introductions.
Store Brands: The Smarter Choice
As ever, store brands represent significant savings for shoppers. The proof can be found in the independent sales data. Using average cost per unit, in a store wide price comparison between store brands and national brands, it is estimated that U.S. consumers save more than $40 billion a year on grocery and household purchases by opting for the store brand over the national brand version of their favorite products.
As well, ongoing audits conducted on behalf of PLMA compare pricing at retail for store brands vs. national brands on about 100 typical shopping cart items in major supermarkets and mass merchandisers in selected markets around the country. These studies consistently demonstrate that shoppers save one-third or more on grocery and household items by selecting store brands over national brands. One of the largest contributing factors to the pricing differential that exists between store brands and national brands is the marketing expense incurred by national brand makers, which is passed on to consumers and referred to by some analysts as the “marketing tax.” Many of the largest CPG companies spend 20 cents or more of every dollar on trade promotion and advertising in an effort to drive sales and share and maintain their position in consumers’ minds. The strategy also supports brand equity in the eyes of key Wall Street analysts and shareholders, who place a premium on the public perception of a brand’s position in the marketplace in addition to the intrinsic worth of the products themselves.
Habit, familiarity, and successful mass market promotion and advertising driven by influential network TV and print newspapers were reasons shoppers were drawn to national brands a half century ago. In the internet and social media age much has changed, not the least consumers’ allegiance to big brands.
Formerly national brand-loyal Americans are now more knowledgeable about the true value of products they buy and they are reaching instead for store brands. In the process, they are building new habits and making new friends. With top quality, unique items and solid savings, store brands add up to a smarter choice for shoppers.